04
Economics

Understand the model. Explain the outcome.

Economics is not a collection of graphs and formulas to memorise. Students learn how one change affects the wider model, then communicate that reasoning through diagrams, calculations, and written analysis.
Request a ConsultationRequest a Consultation
Scroll

taipei  17:55
AP Microeconomics · AP Macroeconomics
The newest of Wallace Academia's three specialisations, built around custom interactive courseware, clear economic reasoning, and disciplined examination preparation.
Aerial black and white nighttime view of a densely built city with numerous buildings and illuminated streets and highways forming lines of light throughout.
01Model into meaning

Interactive Graphs.

A student may recognise a familiar graph and still shift the wrong curve, misread the initial equilibrium, or use the wrong values in a calculation.
Scott has created custom interactive graphs that allow students to change one condition at a time and see how the model responds. Curves move, equilibrium changes, and calculations update immediately, making the relationship between cause and result directly visible.
The student then learns to explain what changed, why the model responded, and how the new outcome follows. This develops a repeatable method for unfamiliar questions rather than dependence on memorised diagrams.
Illuminated modern circular ring ceiling lights in varying sizes against a dark background.

02

One chain, stated out loud

See the relationship.
Explain it.

Scott teaches students to state the complete economic chain in clear language.
interactive graphs are used to test and confirm the reasoning, not to replace it.
    01

    Identify the change

    What event, policy, incentive, or economic condition changed first?

    02

    Apply the model

    Which curve, equation, or accounting relationship is relevant, and how should it respond?

    03

    Trace the effects

    What happens next to price, quantity, output, inflation, unemployment, or economic welfare?

    04

    Explain and verify

    State the complete chain in words, then use the graph or calculation to confirm the conclusion.

Two live graphs sit further down this page: move a variable and the curves, the equilibrium and the welfare areas respond in the same frame, with a sentence beside them stating the causal chain.
City skyline at dusk featuring a large arched bridge over a river, illuminated buildings, and distant mountains under a partly cloudy sky.

03

Course systems

    AP Microeconomics

    How individuals, firms, and governments make decisions when resources are limited: supply and demand, elasticity, consumer and producer behaviour, production costs, market structures, factor markets, externalities, taxation, international trade, efficiency and welfare. Students predict which variable will change, test the result on the graph, complete the calculation, and explain why the outcome follows.

    AP Macroeconomics

    The performance of the economy as a whole: national income accounting, growth, inflation, unemployment, aggregate demand and supply, fiscal and monetary policy, banking, financial markets, exchange rates, and the balance of payments. Students trace how a shock moves through the economy and distinguish short-run from long-run effects.

04
Preparation

Each unit is built
before it is taught.

Each AP Economics unit is developed as a responsive HTML lesson rather than assembled from generic slides or shared documents.
Scott typically spends 8 to 12 hours reviewing the curriculum, coding visual explanations and interactive graphs, verifying numerical examples, and sequencing the questions and practice activities.
These figures describe the development completed before the unit is taught. They are not billable lesson hours and do not guarantee a particular examination result.

8 to 12

hours of development

For each AP Economics unit

Interactive

HTML MODEL

Adjusted during the lesson and available for later review

05

 From the lesson

The material itself,
not a description of it.

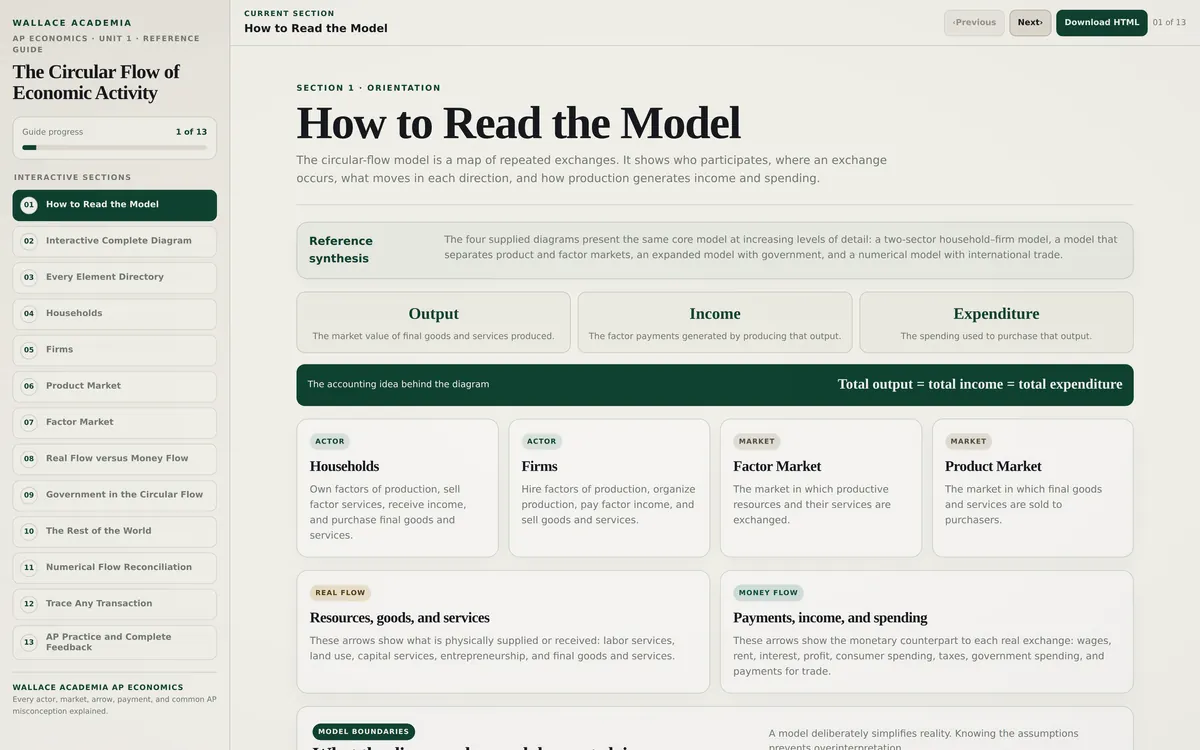
Everything else on this page is a claim about how economics is taught here. This is the teaching. It is one of the reference guides Scott builds for his own students, and it opens in full.
The circular flow is where most AP Economics students first lose the thread, because the diagram is usually presented as something to memorise rather than something to read. This one is built to be read: the layers come on one at a time, and every arrow explains its own direction.

Written by Scott

Not a template, not a purchased resource, and not produced for this website. It is what a student receives.

Webpage titled 'How to Read the Model' from Wallace Academia AP Economics unit, explaining the circular flow of economic activity with sections on output, income, expenditure, and actors like households and firms. It describes markets for factors and products, real flows of resources and goods, and money flows of payments, income, and spending. The page includes a sidebar menu listing interactive sections from guide progress 1 of 13.
AP Economics · Unit 1 · Reference guide

The Circular Flow of Economic Activity

Course
AP Microeconomics and AP Macroeconomics
Level
Grade 10 to Grade 12
Sections
Thirteen, from orientation to examination practice
An interactive diagram that adds government and the rest of the world one layer at a time, and can isolate real flows from money flows.
An inspector: click any actor, market or arrow and it explains the direction, the paired flow, the common misconception and what the examiner does with it.
A transaction tracer, a numerical reconciliation of the flows, and an examination question bank where every wrong choice is explained rather than simply marked wrong.
Taipei
06
The record here, in full

Two years.
Three students.

Scott has taught economics for two years and has worked with three students. In 2025, one student earned scores of 5 in both AP Microeconomics and AP Macroeconomics. A second student earned an A in a non-AP economics course. A third student reported earning a score of 5, although Wallace Academia does not currently hold the official score report. That is the whole of the record. It is the least proven of the three subjects, and saying so is the point of this page.
How the records are presented

Adjust the variable, view the relationship

Supply and demand with a per-unit tax on sellers At a tax of NT$60 a unit, buyers pay NT$210, sellers keep NT$150, and 7.5 thousand units a month change hands.

At NT$60 a unit, buyers pay NT$210 and sellers keep NT$150. The law names the seller; the market names the buyer. NT$42 of the tax, or 70% of it, lands on demand, because supply here is the more elastic side. Quantity falls 1.5 thousand to 7.5 thousand, and NT$45 thousand of surplus is destroyed rather than moved.

Values at a tax of NT$60 a unit
Measure Value
Tax per unit NT$60
Price paid by buyers NT$210
Price received by sellers NT$150
Quantity traded 7.5 thousand
Untaxed price NT$168
Untaxed quantity 9 thousand
Burden carried by buyers NT$42
Burden carried by sellers NT$18
Buyers' share of the tax 70%
Government revenue NT$450 thousand
Consumer surplus NT$788 thousand
Producer surplus NT$338 thousand
Deadweight loss NT$45 thousand

Demand rises by 4 h a week at every price, and only 1 h of that becomes teaching that actually happens: the week goes from 15 h to 16 h. The other 75% of the shift is absorbed by price, which climbs NT$90 to NT$2,040.

07

Scope of the work

    Within Scope

    Drawing, interpreting, and adjusting economic graphs

    Completing calculations accurately and structuring AP free-response answers

    Analysing multiple-choice questions, including why the correct answer works and why each distractor fails

    Tracing a complete causal chain from the initial change to the final economic outcome

    Revising the student's own reasoning and written explanations

    Outside Scope

    Providing answer keys or completed solutions without explanation and instruction

    General homework monitoring without a defined Economics learning objective

    Completing assessed work on the student's behalf

    Mathematics instruction beyond the calculations required for AP Economics

    Promising a particular course grade or examination score

08
Consultation
Send the current
unit, the latest assessment, and one difficult question.
Where possible, include the student's working, graph, and teacher feedback. Scott will identify whether the difficulty lies in subject knowledge, selecting the correct economic model, interpreting the graph, completing the calculation, or explaining how one change leads to another. This determines the first priority for instruction.

Request a ConsultationRequest a Consultation

Next
Examination Preparation

Wallace Academia

A Private Academic Practice ·
Taipei

Website created byHoney Honey Agency